


A Fun Guide to Convert Temperatures in Everyday Life
Nearly everything we do is affected by temperature. So whether you’re deciding if it’s cold enough for a jacket, or trying to bake a perfect batch of cookies, having the correct temperature is crucial.
But the trouble is, different countries use different temperature scales. The United States uses Fahrenheit most, while much of the world runs Celsius. Kelvin is the choice for scientists doing experiments.
This creates confusion. You may have a recipe that’s from France that recommends cooking something at 180°C however your oven only has Fahrenheit labels. Or you’re headed to Canada in late spring, and the weather prediction is 25°C for your visit, making you question whether to bring shorts or a sweater.
And that’s when temperature conversion charts become very handy. They do away with all the guesswork and enable you to make fast, accurate conversions without the need for any complex math.
In this guide, you will find 11 handy conversion charts for everything from cooking temperatures to weather. Each graphic should be simple, clear and quickly actionable. For more helpful measurement conversion resources and guides, you can explore comprehensive tools that make everyday conversions easier.
The Three Primary Temperature Scales You Should Learn
Before we jump into the conversion charts, I want to give you a quick overview of each of the three temperature measurement systems that are used by people around the world.
Fahrenheit Scale
This scale was developed by Daniel Gabriel Fahrenheit in the year 1724. Standard temperature is when water freezes at 32°F and boils at 212°F. Most people in the United States use this scale for weather, cooking and most other common temperature measurements.
Celsius Scale
This scale, also known as Centigrade, was introduced by Anders Celsius in 1742. Water freezes at 0 degrees Celsius and boils at 100 degrees Celsius – a more intuitive system that is the standard in almost every country, except (ironically) the United States.
Kelvin Scale
This scale was set up by Lord Kelvin in 1848 for scientific work. It is based on absolute zero (the coldest possible temperature) and uses the same size degrees as Celsius. Scientists go gaga for it because there are no negative numbers.
Water freezes at 273.15 K and boils at 373.15 K.
Chart 1: Comparison of Cooking Temperatures
Cooking requires precision. Choose the wrong temperature and you could potentially ruin your meal. Here’s a guide for you on normal baking and cooking temperatures.
| Fahrenheit (°F) | Celsius (°C) | Common Use |
|---|---|---|
| 325°F | 163°C | Slow roasting, cheesecakes |
| 350°F | 177°C | Most baking, cakes, cookies |
| 375°F | 191°C | Roasting vegetables, baking fish |
| 400°F | 204°C | Roasting chicken, pizza |
| 425°F | 218°C | Fast roasting, crispy foods |
| 450°F | 232°C | High-heat roasting, bread |
| 475°F | 246°C | Pizza stones, searing |
| 500°F | 260°C | Professional pizza ovens |
Most home ovens stop at 500°F. Professional kitchens can get hotter than that.
Bear in mind that when you’re converting recipes, oven temperatures don’t have to be precise down to the degree. Rounding is fine to the nearest 5 or 10 degrees.
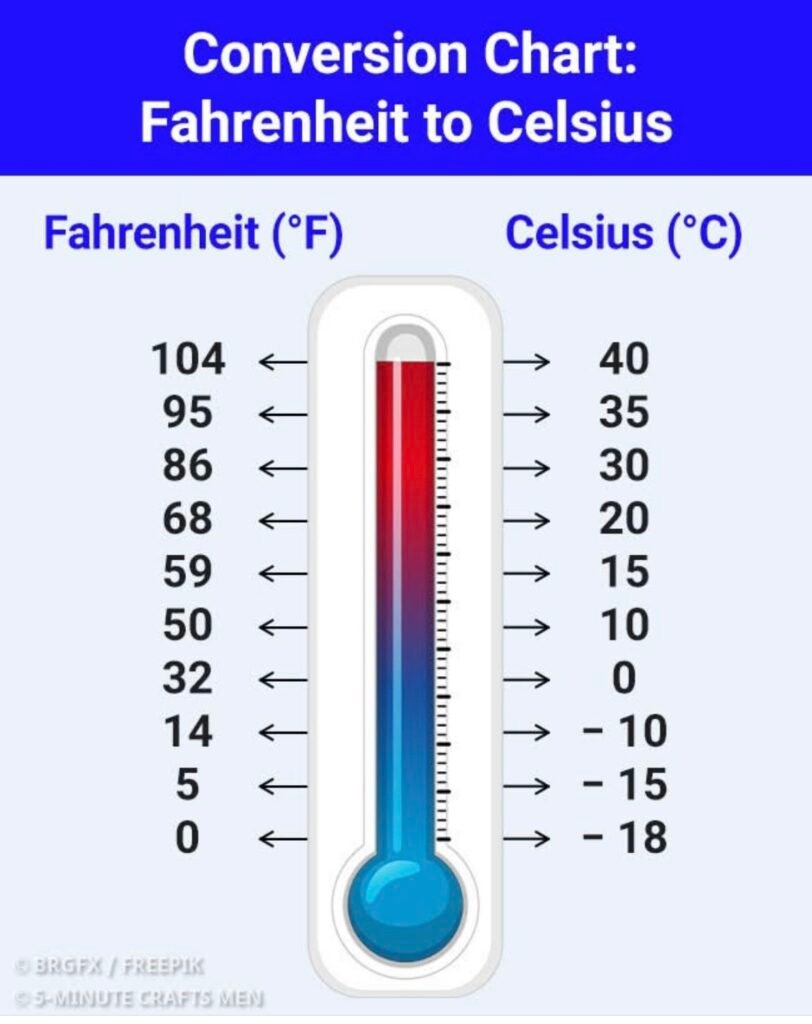
Chart 2: Weather Temperature Comparison Guide
Weather forecasts are simpler to follow when you can convert temperature values between Celsius and Fahrenheit. This graph shows normal weather conditions.
| Celsius (°C) | Fahrenheit (°F) | Weather Description |
|---|---|---|
| -40°C | -40°F | Dangerously cold, frostbite risk |
| -18°C | 0°F | Very cold winter day |
| 0°C | 32°F | Water freezes, snow possible |
| 10°C | 50°F | Cool, light jacket needed |
| 20°C | 68°F | Comfortable room temperature |
| 25°C | 77°F | Warm and pleasant |
| 30°C | 86°F | Hot summer day |
| 37°C | 98.6°F | Human body temperature |
| 40°C | 104°F | Extremely hot, heat warning |
This chart helps travelers pack for (and understand) local weather when traveling internationally.
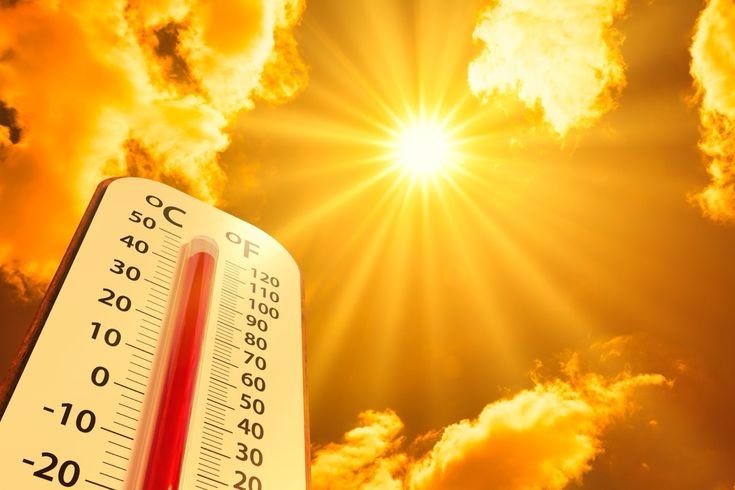
Chart 3: Body Temperature and Health Monitoring
Keep track of your body temperature for good health! This chart provides normal and alarming temperature ranges.
| Celsius (°C) | Fahrenheit (°F) | Health Status |
|---|---|---|
| 35°C | 95°F | Hypothermia risk |
| 36°C | 96.8°F | Below normal, monitor closely |
| 36.5°C | 97.7°F | Normal range (lower end) |
| 37°C | 98.6°F | Average normal temperature |
| 37.5°C | 99.5°F | Normal range (higher end) |
| 38°C | 100.4°F | Low-grade fever |
| 39°C | 102.2°F | Moderate fever |
| 40°C | 104°F | High fever, seek medical care |
| 41°C | 105.8°F | Dangerous, emergency care needed |
The body temperature can change some over the course of the day. It’s at its highest in the late afternoon, and its lowest early in the morning.
Various measurement methods (oral, ear, forehead, rectal) also can produce slightly different results.
Chart 4: Water Temperature for Different Activities
Water temperature plays a key role in how water feels and which activities are safe. This reference chart is based on different aquatic activities.
| Celsius (°C) | Fahrenheit (°F) | Activity/Description |
|---|---|---|
| 0°C | 32°F | Water freezes solid |
| 10°C | 50°F | Painfully cold, wetsuit required |
| 15°C | 59°F | Cold swimming, not recommended |
| 20°C | 68°F | Cool but tolerable for swimming |
| 25°C | 77°F | Comfortable pool temperature |
| 30°C | 86°F | Warm bath or hot tub |
| 37°C | 98.6°F | Body temperature bath |
| 40°C | 104°F | Hot bath, very relaxing |
| 60°C | 140°F | Too hot for bathing, scalding risk |
| 100°C | 212°F | Water boils |
Elite swimmers train in pools that are usually maintained at a temperature range of 25–28°C (77–82°F). Occasionally recreational pools are a few degrees warmer for comfort.
Chart 5: Food Safety Temperature Guidelines
Cooking to the correct internal temperature is very important for food safety. This prevents foodborne illness.
| Celsius (°C) | Fahrenheit (°F) | Food Item |
|---|---|---|
| 63°C | 145°F | Medium-rare beef, fish |
| 68°C | 154°F | Medium beef |
| 71°C | 160°F | Ground beef, pork |
| 74°C | 165°F | Chicken breast, reheated leftovers |
| 77°C | 170°F | Chicken thighs, whole poultry |
| 85°C | 185°F | Braised meats, falling apart tender |
Test for doneness with a food thermometer. Color is not the only way to judge whether meat has been cooked enough. According to the USDA Food Safety and Inspection Service, using proper internal temperatures is essential for preventing foodborne illness.
Let the meat rest for a few minutes after cooking. The temperature increases gently during this period.
Chart 6: Science Lab Common Temperature Points
These reference temperatures are often needed by students and scientists for experiments and calculations.
| Celsius (°C) | Fahrenheit (°F) | Kelvin (K) | Scientific Significance |
|---|---|---|---|
| -273.15°C | -459.67°F | 0 K | Absolute zero (theoretical) |
| -196°C | -321°F | 77 K | Liquid nitrogen boiling point |
| -78°C | -109°F | 195 K | Dry ice (solid CO₂) |
| 0°C | 32°F | 273.15 K | Water freezing point |
| 25°C | 77°F | 298.15 K | Standard room temperature |
| 100°C | 212°F | 373.15 K | Water boiling point |
In the context of science labs, room temperature has been defined as 25°C so that experiment results can be easily replicated in any location.
Chart 7: Beverage Serving Temperature Guide
The correct temperature improves the taste of drinks. This guide helps you offer beverages at their peak.
| Celsius (°C) | Fahrenheit (°F) | Beverage Type |
|---|---|---|
| 3-7°C | 37-45°F | Beer (lagers and light beers) |
| 10-13°C | 50-55°F | White wine, rosé |
| 12-18°C | 54-65°F | Red wine (varies by type) |
| 60-70°C | 140-158°F | Hot coffee, ideal drinking temp |
| 71-85°C | 160-185°F | Freshly brewed coffee |
| 70-80°C | 158-176°F | Green tea brewing |
| 85-95°C | 185-203°F | Black tea brewing |
| 100°C | 212°F | Boiling water for tea/coffee |
Temperature has a major influence on how we experience tastes. Drinks that are too cold can get the taste buds numb, whereas drinks that are too hot can burn the tongue and mask subtle flavors.
Chart 8: HVAC and Home Comfort Temperature Range
Heating and cooling systems function best within certain temperature ranges. This chart provides the recommended settings for comfort and efficiency.
| Celsius (°C) | Fahrenheit (°F) | Season/Application |
|---|---|---|
| 15-18°C | 59-64°F | Sleeping, winter night setting |
| 18-20°C | 64-68°F | Winter daytime, energy saving |
| 20-22°C | 68-72°F | Comfortable living space |
| 22-24°C | 72-75°F | Warmer comfort preference |
| 24-26°C | 75-79°F | Summer cooling setting |
| 26-28°C | 79-82°F | Minimal cooling, energy saving |
The World Health Organization says that homes should not be cooler than 18°C (64°F) for healthy adults. The elderly or very young may require warmer temperatures.
Each single degree shift you make with your thermostat could change your energy bill by up to 3-5 percent.
Chart 9: Industrial and Manufacturing Temperature Standards
Most of the manufacturing processes need to maintain an accurate temperature. These are typical industrial landmarks.
| Celsius (°C) | Fahrenheit (°F) | Industrial Application |
|---|---|---|
| 180°C | 356°F | Plastic molding (varies by type) |
| 232°C | 450°F | Solder melting (lead-free) |
| 327°C | 621°F | Lead melting point |
| 660°C | 1220°F | Aluminum melting point |
| 1064°C | 1947°F | Gold melting point |
| 1538°C | 2800°F | Iron melting point |
Various materials have their own processing temperature. Engineers need to convert between systems when using international standards.
Chart 10: Quick Mental Math Conversion Formulas
Occasionally you want to convert temperatures without referring to a chart. These formulas and shortcuts help.
Celsius to Fahrenheit:
- Multiply by 9, divide by 5, and to this product add 32
- Quick estimate: Double it and add 30 (close enough for weather)
Fahrenheit to Celsius:
- Subtract 32, multiply by 5, divide by 9
- Quick estimate: Subtract 30 and divide by 2
Celsius to Kelvin:
- Add 273.15 (or just add 273 for estimates)
Kelvin to Celsius:
- Subtract 273.15
Mental Math Examples
If the weather report predicts 20°C, you can calculate in a flash:
- 20 × 2 = 40
- 40 + 30 = 70°F (actual: 68°F)
If a recipe calls for 350°F:
- 350 – 30 = 320
- 320 ÷ 2 = 160°C (actual: 177°C, close enough)
These shortcuts won’t deliver precise answers, but they are close enough to be useful in day-to-day life.
Chart 11: Extreme Temperature Records and References
Once you are able to understand the extremes, it helps put everyday measurements in perspective.
| Celsius (°C) | Fahrenheit (°F) | Record/Reference |
|---|---|---|
| -89°C | -128°F | Coldest recorded on Earth (Antarctica) |
| -40°C | -40°F | Only point where C and F are equal |
| 56.7°C | 134°F | Hottest recorded on Earth (Death Valley) |
| 5500°C | 9932°F | Surface of the Sun |
| 15,000,000°C | 27,000,000°F | Core of the Sun |
The coincidence that -40°C is the same as -40°F is a fun one that many people do not expect to be true.
How to Use These Charts Effectively
These conversion charts are best kept close at hand. Here are practical tips:
Save them to your phone. Screenshots and bookmark this page for easy access while cooking or on the road.
Print the ones you use most. Attach a cooking temperature chart inside of a kitchen cabinet. If traveling abroad, carry a card with you of all the popular weather conversions.
Practice the mental math shortcuts. The more you do it, the more quickly you’ll be able to estimate conversions.
Use the appropriate chart for the appropriate situation. Food safety requires exact temperatures. Weather predictions can be approximate.
Double-check when precision matters. For medical temperatures or scientific work, use a calculator to check conversion results.
Frequently Asked Questions
What’s the easiest way to convert Celsius to Fahrenheit?
For a rough estimate, double the Celsius temperature, then add 30. For example, 25°C × 2 = 50, +30 = 80°F. It’s not exactly accurate – yes of course, the precise result is 77°F but you are close enough for most things.
Why does the United States still use Fahrenheit?
The US began using Fahrenheit before the metric system became popular. It would take replacing every thermometer, oven, thermostat and weather system in the country. The cost and effort have prevented the switch.
Which temperature scale is most accurate?
The three scales are all accurate. They’re different ways of measuring the same thing. Scientists prefer Kelvin because it starts at absolute zero and has no negative numbers, making calculations easier.
At what temperature are Celsius and Fahrenheit the same?
At minus 40 degrees, the two scales read the same amount. This is the only temperature at which -40°C equals -40°F.
Do I need exact conversions for cooking?
Not usually. For most recipes, rounding oven temperatures to the nearest 5 or 10 degrees is perfectly acceptable. A couple of degrees won’t spoil the dish. But when it comes to candy making or precise baking, closer accuracy is useful.
How hot is too hot for a fever?
Any temperature above 103°F (39.4°C) in an adult could be dangerous and may require immediate medical attention. For children, any temperature of 102°F (38.9°C) or higher lasting more than a day is a good reason to see the doctor.
Why does water boil at different temperatures in the mountains?
Air pressure affects boiling point. At sea level, water boils at 100°C (212°F). At higher elevations, there’s less atmosphere above you, so the air pressure is lower. Water will boil at a lower temperature. Water boils around 95°C (203°F) in Denver, Colorado.
Can I convert negative temperatures using the same formulas?
Yes. The conversion formulas are valid for temperatures of any sign, including negative ones. Just watch the math when dealing with negative numbers.
Making Temperature Conversion Second Nature
It will come much more easily with practice. Begin with a few easy reference points: Water freezes at 0°C/32°F, room temperature is roughly 20°C/68°F and body temperature is 37°C/98.6°F.
Use these references to estimate other temperature differences. You know if it’s 10°C, that is 10 degrees below room temperature in Celsius which corresponds to being about 18 degrees below room temperature in Fahrenheit (so you’re at around 50°F).
The more you play with temperature scales, the more intuitive they get. You’ll eventually be able to convert common temperatures without consulting a chart.
Final Thoughts on Temperature Measurement
Converting between temperatures shouldn’t be hard. Use these 11 charts to quickly reference everything you’ll need by season or condition.
Whether you’re making dinner from a recipe chosen from a global destination, figuring out what to pack for that trip to Europe or deciding if your child’s fever is worrisome, or even doing science experiments at home, the right conversion chart could make everything easier.
Leave these charts out in the open, work through the mental math shortcuts and you’ll develop an intuition for working with Celsius, Fahrenheit, and Kelvin.
Temperature is one of the measurements we deal with most on a daily basis. Knowing how to convert between scales is empowering in all sorts of situations.
Put these charts to use now, and temperature conversion will be as natural as breathing.

