


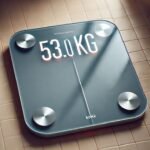


8 Ultimate Weight Measurement Errors I’ll Never Make Again
Weight seems like a simple number. You step on a scale, you look down, and there it is — a neat, definitive measurement. Or so I used to believe.
Over the years, whether tracking body weight, shipping packages, measuring ingredients, or recording data for training progress, I’ve made nearly every mistake possible when it comes to weight measurement. Some were small oversights. Others led to weeks of confusion, frustration, and completely inaccurate conclusions.
This article isn’t just about stepping on a bathroom scale. It’s about understanding how measurement works — and how easily we sabotage our own data without realizing it.
Here are the eight weight measurement errors I’ll never make again — along with practical corrections, data comparisons, and reference tables to help you avoid them too.
Error #1: Weighing at Random Times of Day
For a long time, I weighed myself whenever it crossed my mind — morning, afternoon, post-workout, before bed. I assumed weight was stable enough that timing didn’t matter.
It absolutely does.
Body weight fluctuates significantly throughout the day due to:
- Hydration levels
- Food intake
- Glycogen storage
- Sodium consumption
- Hormonal shifts
- Bowel movements
Daily Weight Fluctuation Example
| Time of Day | Weight (lbs) | Change from Morning |
|---|---|---|
| 6:30 AM (fasted) | 180.0 | 0 |
| 10:00 AM | 181.2 | +1.2 |
| 2:00 PM | 183.5 | +3.5 |
| 6:00 PM | 184.1 | +4.1 |
| 10:00 PM | 182.7 | +2.7 |
That’s over a 4-pound swing — in one day — without any fat gain.
Lesson Learned
Consistency beats frequency.
Best practice:
- Weigh yourself first thing in the morning
- After using the restroom
- Before eating or drinking
- Wearing minimal clothing
When measurements are standardized, trends become meaningful.
Error #2: Ignoring Scale Calibration
I once replaced a scale and gained 3 pounds overnight. Except I hadn’t.
Scales drift over time. Digital sensors degrade. Mechanical springs weaken. Uneven flooring alters readings.
Calibration Comparison
| Scale Condition | Known 20 lb Weight | Displayed Weight | Error |
|---|---|---|---|
| Properly Calibrated | 20.0 lbs | 20.0 lbs | 0 |
| Slight Drift | 20.0 lbs | 20.8 lbs | +0.8 |
| Uneven Floor | 20.0 lbs | 19.3 lbs | -0.7 |
| Low Battery | 20.0 lbs | 21.4 lbs | +1.4 |
That’s a potential 1–2 pound distortion — enough to derail motivation.
Correction Strategy
- Place scale on hard, flat flooring
- Recalibrate monthly (use known weight like dumbbell or weight plate)
- Replace batteries proactively
- Avoid moving scale frequently
Measurement is only as reliable as the instrument.
Error #3: Comparing Different Scales
I once weighed myself at home, then at the gym, then at a doctor’s office — and tried to reconcile the numbers.
That was a mistake.
Each scale has:
- Different sensitivity thresholds
- Different calibration standards
- Different surface stability
- Different internal algorithms
Real-World Comparison
| Location | Measured Weight |
|---|---|
| Home Scale | 178.4 lbs |
| Gym Scale | 180.2 lbs |
| Doctor’s Office | 179.6 lbs |
Which one was correct? Possibly none of them — or all of them within their margin of error.
What I Now Do
I use one scale for trend tracking.
Medical measurements are separate. Gym scales are irrelevant. Trend tracking requires a consistent tool.
Error #4: Misunderstanding Water Weight
This was the most psychologically damaging mistake.
I thought weight increases meant fat gain. Not water. Not glycogen. Not sodium retention.
But 1 gram of glycogen binds roughly 3 grams of water. That means:
- A high-carb meal can cause several pounds of water retention
- A salty meal can temporarily spike scale weight
- Hormonal cycles can shift fluid levels dramatically
Carbohydrate & Water Storage Table
| Carbohydrate Intake Increase | Estimated Glycogen Gain | Water Retained | Total Temporary Weight |
|---|---|---|---|
| +150g carbs | 150g | 450g | ~1.3 lbs |
| +300g carbs | 300g | 900g | ~2.6 lbs |
| +500g carbs | 500g | 1500g | ~4.4 lbs |
That “3 pound gain overnight” wasn’t fat. It was physiology.
Long-Term Insight
Fat gain requires sustained caloric surplus over time.
Water gain can happen within hours.
Never confuse the two.
Error #5: Focusing on Single Measurements Instead of Trends
One day, I was up 2 pounds. I panicked.
Three days later, I was down 1.5 pounds.
The truth? I should never have reacted to one data point.
Weight should be analyzed as a rolling average.
Sample 7-Day Rolling Average
| Day | Weight | 7-Day Average |
|---|---|---|
| Mon | 180.0 | — |
| Tue | 179.8 | — |
| Wed | 180.5 | — |
| Thu | 181.0 | — |
| Fri | 179.6 | — |
| Sat | 180.2 | — |
| Sun | 179.9 | 180.14 |
That average is far more meaningful than any individual day.
Trend Visualization (Text Chart)
Weight: 180 ──┐
179 ──┐   ┌───┘
181 ──┘───┘
Spikes don’t equal failure. Patterns matter.
Error #6: Wearing Different Clothing Each Time
It sounds trivial. It isn’t.
Clothing weight can range dramatically.
| Clothing Type | Average Weight |
|---|---|
| Underwear only | 0.2–0.5 lbs |
| T-shirt + shorts | 0.8–1.2 lbs |
| Jeans + shirt | 1.5–2.5 lbs |
| Shoes | 1.0–3.0 lbs |
A pair of heavy jeans and shoes can distort readings by 3–5 pounds.
My Rule Now
Same time.
Same scale.
Same clothing (or none).
Error #7: Ignoring Environmental Factors
Humidity, temperature, and even altitude can influence scale readings — especially sensitive digital models.
Environmental Impact Overview
| Factor | Effect on Measurement |
|---|---|
| High Humidity | Sensor interference |
| Carpeted Floor | Uneven distribution |
| Cold Surface | Battery performance issues |
| Uneven Tile | Load imbalance |
I once placed a scale half-on, half-off a tile seam. The result? A 2-pound discrepancy.
The fix was embarrassingly simple: move it 3 inches.
Error #8: Confusing Weight With Progress
This was the most important lesson.
Weight is only one metric.
You can:
- Lose fat and gain muscle simultaneously
- Reduce body fat while scale weight stays constant
- Gain water during recovery
- Appear leaner at the same weight
Body Composition Example
| Month | Weight | Body Fat % | Fat Mass | Lean Mass |
|---|---|---|---|---|
| January | 180 lbs | 20% | 36 lbs | 144 lbs |
| March | 180 lbs | 16% | 28.8 lbs | 151.2 lbs |
Same weight. Very different composition.
The scale doesn’t tell the whole story.
Putting It All Together: A Smarter Weight Tracking Framework
After years of trial and error, here’s the system I follow now:
Step 1: Standardize Conditions
- Morning weigh-in
- Fasted
- After restroom
- Same scale
- Same location
Step 2: Track Daily
But analyze weekly averages.
Step 3: Pair Weight with Other Metrics
| Metric | Why It Matters |
|---|---|
| Waist Measurement | Tracks fat loss |
| Progress Photos | Visual changes |
| Strength Levels | Muscle retention/gain |
| Energy Levels | Recovery indicator |
Step 4: Accept Fluctuations
Normal fluctuation range:
- ±1% bodyweight daily
- ±2–4 lbs water shift possible
Quick Reference Chart: Weight Error Prevention Checklist
☑ Same time daily
☑ Same scale
☑ Hard, flat surface
☑ Calibrated monthly
☑ Minimal clothing
☑ Track averages
☑ Understand water retention
☑ Measure more than weight
Deeper Insight: Why Humans Misinterpret Weight Data
Our brains crave certainty.
But biological systems are dynamic. Weight is not static mass — it’s a composite of:
- Fat tissue
- Muscle tissue
- Glycogen
- Water
- Digestive contents
- Hormonal shifts
The scale measures total gravitational force — not composition.
Without context, it becomes misleading.
Example Scenario: Two Weeks of “False Panic”
| Day | Weight | Reaction (Old Me) | Reality |
|---|---|---|---|
| Mon | 180.0 | Neutral | Baseline |
| Tue | 181.4 | Anxiety | High sodium |
| Wed | 182.0 | Panic | Carb refeed |
| Thu | 180.8 | Confusion | Water drop |
| Fri | 179.5 | Relief | Normal fluctuation |
Fat change over 5 days? Almost none.
But emotionally? A rollercoaster.
The Physics Behind Weight Measurement
Weight = Mass × Gravitational Acceleration.
Bathroom scales measure force exerted downward.
But the reading can shift based on:
- Center of pressure
- Load distribution
- Sensor accuracy
- Mechanical wear
Higher-end scales use strain gauges with multiple load cells. Budget models often rely on fewer sensors — meaning uneven stance can distort readings.
Standing slightly forward or backward can alter output by fractions of a pound.
Consistency solves this.
A Simple Weight Trend Formula
If you want cleaner trend analysis:
Weekly Average = (Sum of 7 daily weights) / 7
Monthly Trend = Compare weekly averages
That smooths noise dramatically.
Final Lessons I’ll Never Forget
- Weight fluctuates more than fat does.
- Consistency is more important than precision.
- Calibration prevents psychological damage.
- One measurement means nothing.
- Trends reveal truth.
- Water is deceptive.
- Clothing matters.
- The scale is a tool — not a judge.
Frequently Asked Questions (FAQs)
1. How much can body weight naturally fluctuate in a day?
Daily fluctuations of 1–4 pounds are completely normal, primarily due to hydration, food intake, sodium, and glycogen levels. This is not fat gain.
2. How often should I weigh myself?
Daily weigh-ins under standardized conditions provide the most useful data — but analyze weekly averages rather than individual readings.
3. Is morning really the best time to weigh yourself?
Yes. Morning (after using the restroom and before eating or drinking) provides the most consistent baseline measurement.
4. Can a salty meal really increase scale weight overnight?
Absolutely. Sodium increases water retention, which can temporarily add 1–3 pounds.
5. Why does my weight go up after a hard workout?
Muscle inflammation and glycogen replenishment cause temporary water retention. This is recovery, not fat gain.
6. Should I trust body fat scales?
Bioelectrical impedance scales can provide trends, but they are sensitive to hydration levels. Use them consistently under the same conditions, and focus on long-term patterns.
Closing Thoughts
Weight measurement isn’t about obsession — it’s about understanding variables.
The number on the scale is data. And data without context is noise.
Once I stopped reacting emotionally and started analyzing trends intelligently, weight tracking became empowering instead of stressful.
I still step on the scale.
But now I know what it really means — and what it doesn’t.